Characterizing Mapping Quality Recalibration Approaches in a Variant Graph Genomics Tool
This was my research project as part of my summer intership with the BD2K program at UC Santa Cruz Genomics Institute. I was under the supervision of Bendict Paten and Adam Novak. For more details go to the github page.
Motivation
Identifying DNA patterns can tell us useful information about any living being. Closely related organisms have similar DNA, while distantly related organisms have few similarities. Humans have extremely similar genomes; studying differences can help to identify particular variants that can cause illness. Vg is a variant graph-based alignment tool for DNA mapping using graph genome references; these graphs capture variation information from populations, which allows more accurate genome studies.
vg
Vg is a set of tools for working with genome variation graphs. These graphs consist of a set of nodes and edges, where each node represents a DNA sequence; edges, connections between two nodes, can be seen as concatenations of two sequences. We built VG graphs with genome references and their sequence variations. Because of the variation we have multiple paths through the graph, this means from a particular sequence you could have multiple edges to take.

An essential part of vg is mapping DNA reads into the graph; that means searching for the position where the sequence is most similar to the reference graph. Mapping is challenging because genomes can be very repetitive, and in each repetition, sequences can vary. In addition to mapping, vg calculates a mapping quality score; this score is the probability of the mapping being wrong.
Graph image was created using Sequence TubeMap Tool
Approach
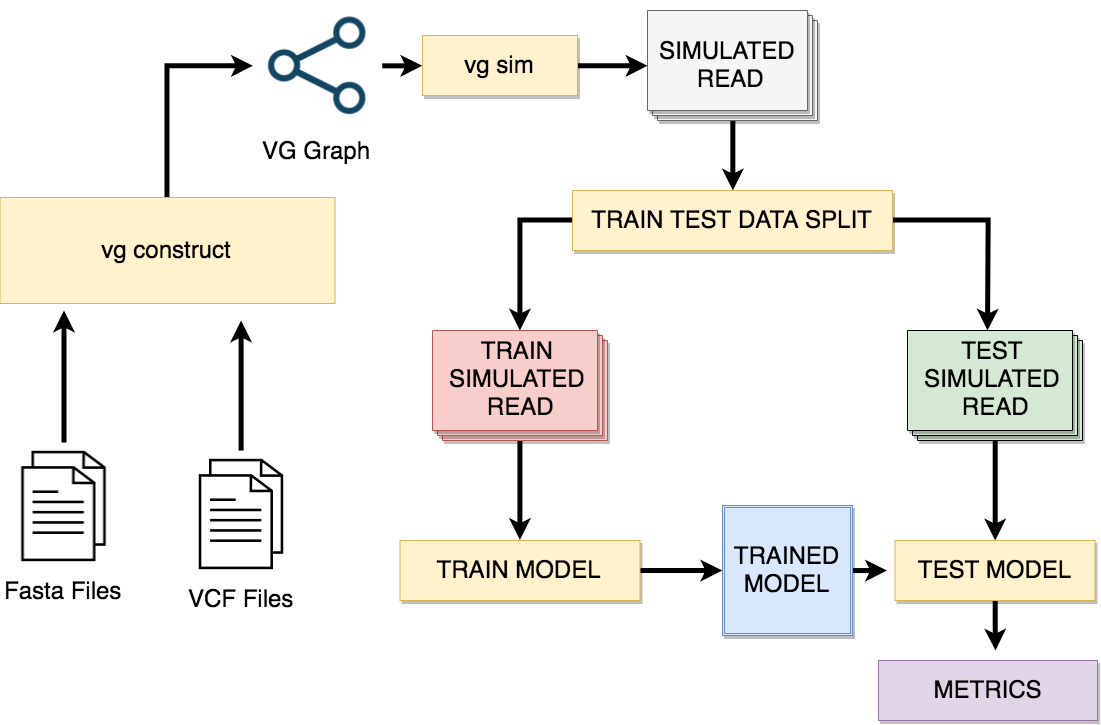
In this work, we create and benchmark models to predict the probabilities of mappings being wrong and compare our recalibration models against each other and against the original mapping quality scores. To build our dataset, we simulate sequences with errors from the reference graph and map these new sequences back into the graph, then label those mappings as correct or incorrect. We train our models to calculate when a mapping is wrong, then extract the probabilities from those predictions. Using these probabilities, we calculate mapping quality scores and compare them against the original scores calculated by vg using the Brier score.

Discussion
We test 5 different models with logistic regression using mapping quality information, mems, sequences, mems stats and a combination between mems and sequences. Our experiments show that logistic regression with mems improves by 5.23% the original mapping score given by vg in reads of length 100 base pairs but is not able to generalize well across lengths. But the Q-Q plot shows that the mems model has over confidence about its predictions.
References
- Garrison, Erik, et al. “Sequence variation aware genome references and read mapping with the variation graph toolkit.” bioRxiv (2017): 234856.