An Intuitive Introduction to Machine Learning
Introduction
I believe everyone has heard about machine learning and how it has been accelerating science and industries. Protein folding, antibiotic discovery, and robust animal behavior monitoring are examples of how machine learning has accelerated science advances. Many industries such as finance, health, and even software engineering have been applying machine learning to facilitate, automate, or guide essential processes. Machine learning has changed the paradigms from explicitly programming to training a machine learning model for some tasks that are hard to program. Andrej Karpathy explained more about this in his blog post titled Software 2.0.
In many applications, machine learning seems to work like magic but isn’t magic. The purpose of this blog post is to uncover the magic behind machine learning and answer; how does machine learning learn from the data to make decisions?
Keep in mind that the goal of machine learning is to learn a decision function based on training data meanwhile generalizing to new examples. There are three crucial aspects from this description: 1) the decision function; 2) how efficiently represent the input data?; 3) how to measure the model generalization? In the next section, I will introduce the intuition of these aspects but first a motivation example.
Decision Function
Imagine a simple case where you are designing an application to know if today is a good day to go to the beach? Usually, when I go to the beach, I check two measurements: 1) precipitation probability and 2) rip currents. If we collect these measurements from previous days and plot them, we get the following graph in Figure 1. This graph has labeled examples of good days (blue dots) and bad days (red dots). Note that the x-axis shows the precipitation probability, and the y-axis shows rip currents.
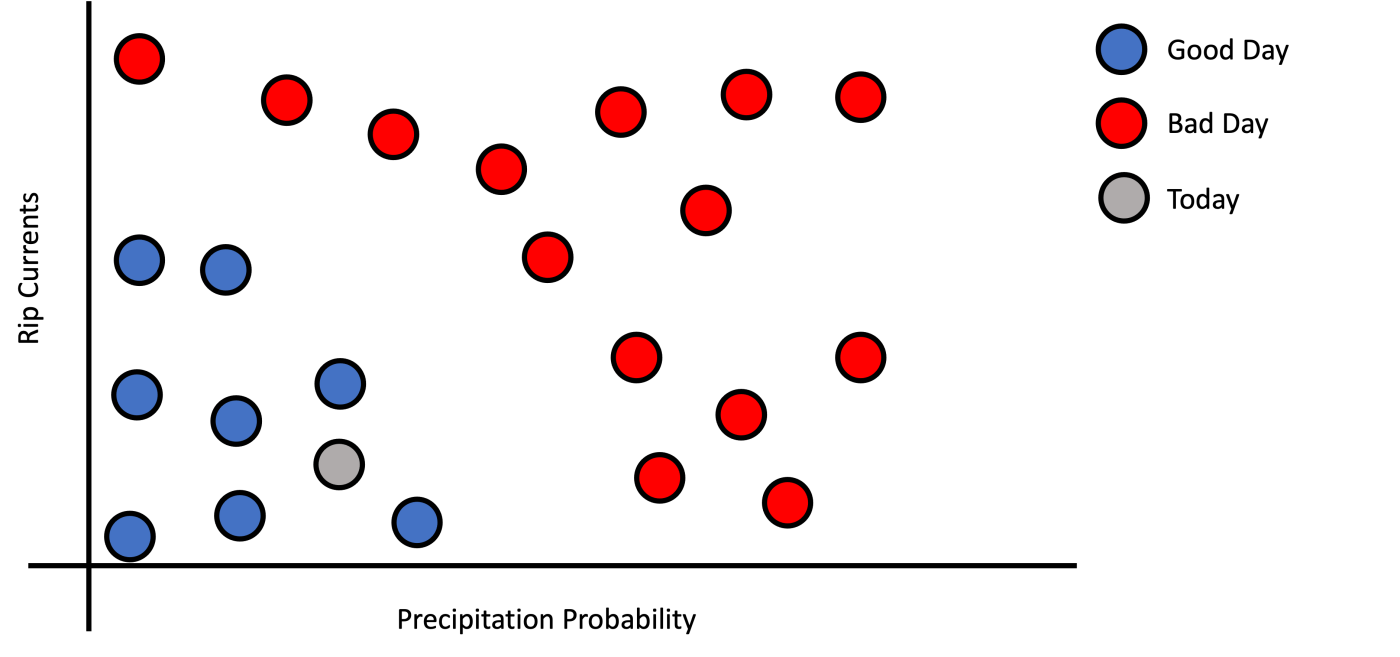
If I ask you, based on today’s measurements (grey dot), if today is a good day to go to the beach, what would be the answer? If you answered yes, you immediately noticed a pattern on the graph; good days are clustered at the bottom left of the graph, therefore because today’s dot is in that region, then today should be a good day to go to the beach. But what mean to be in the blue region? Well, good days have low precipitation probability and low rip current.
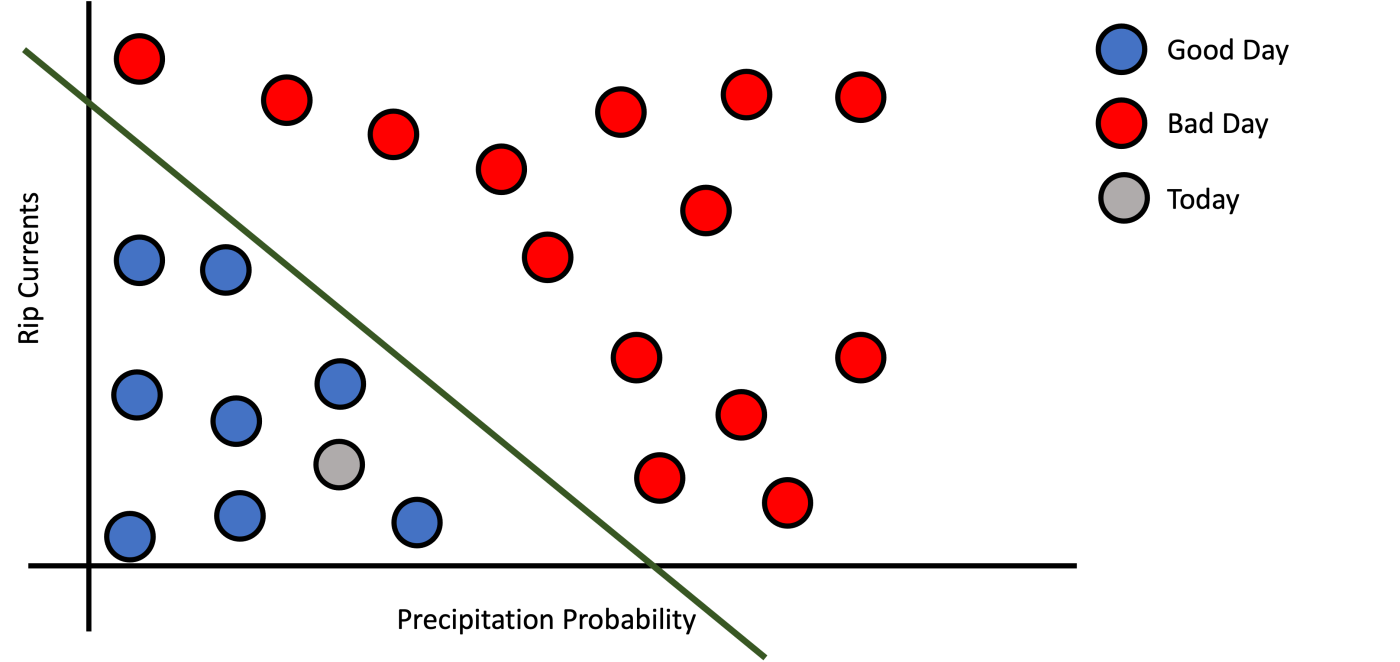
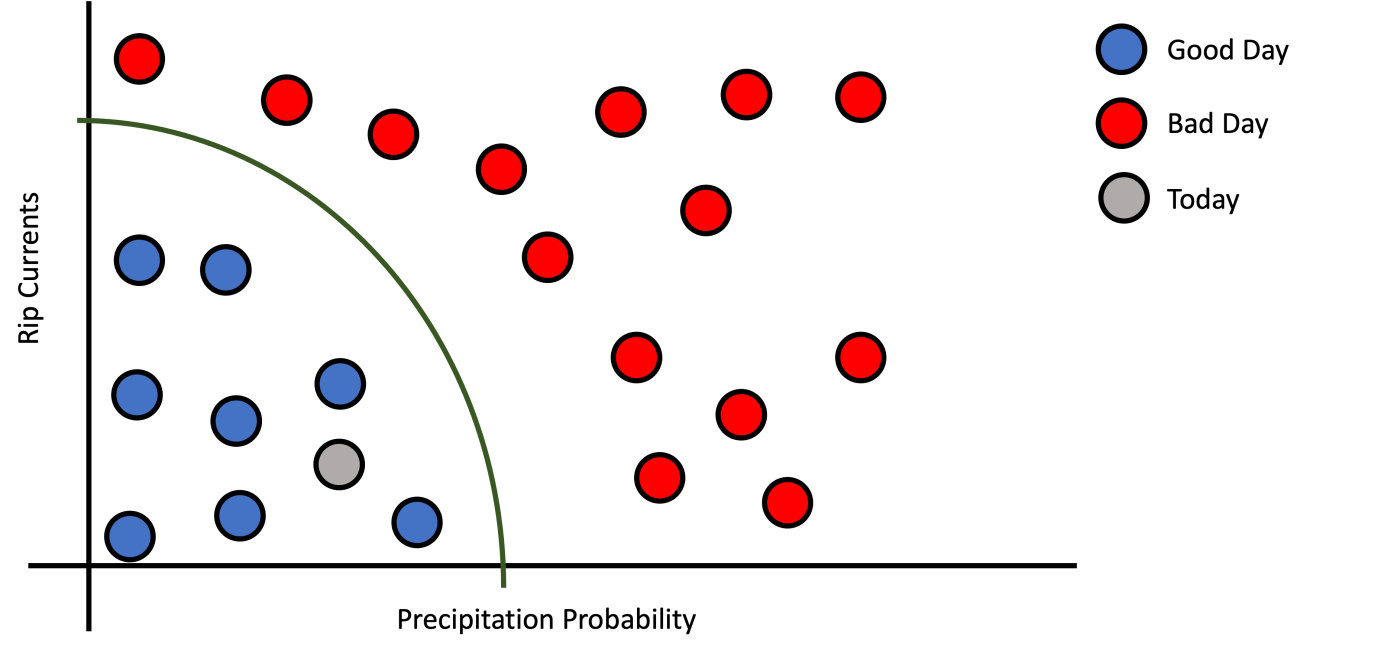
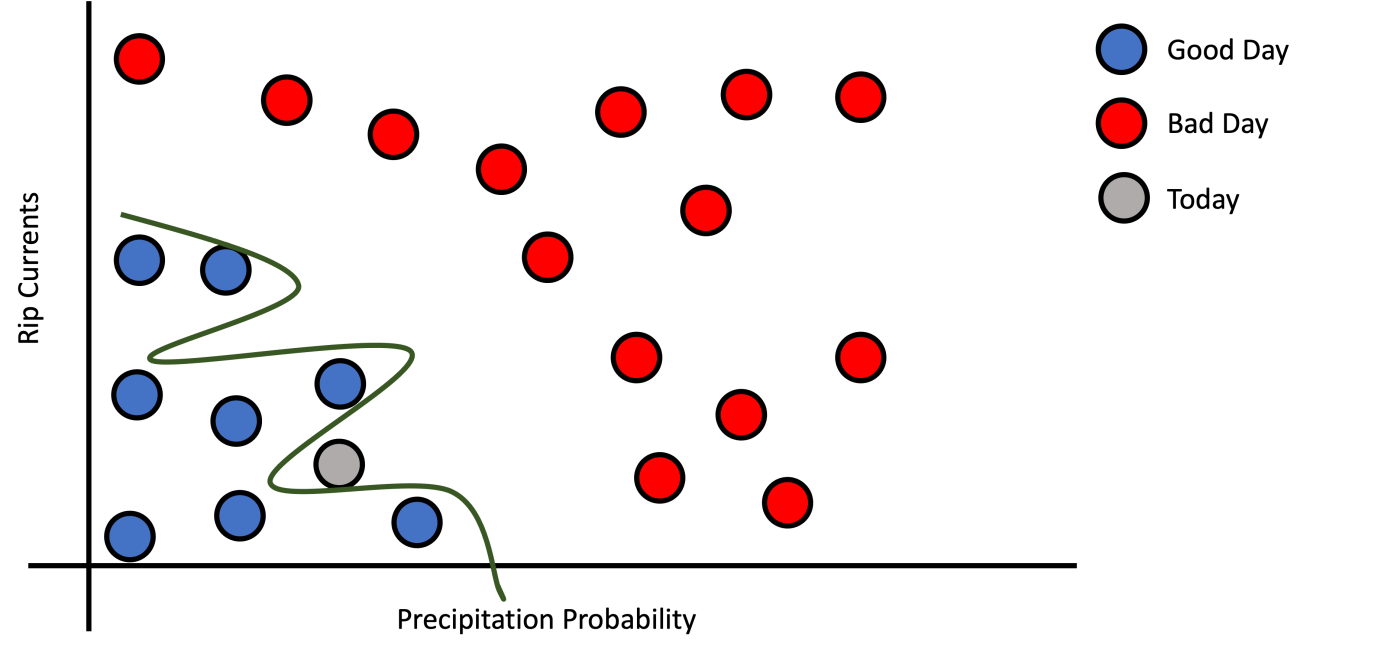
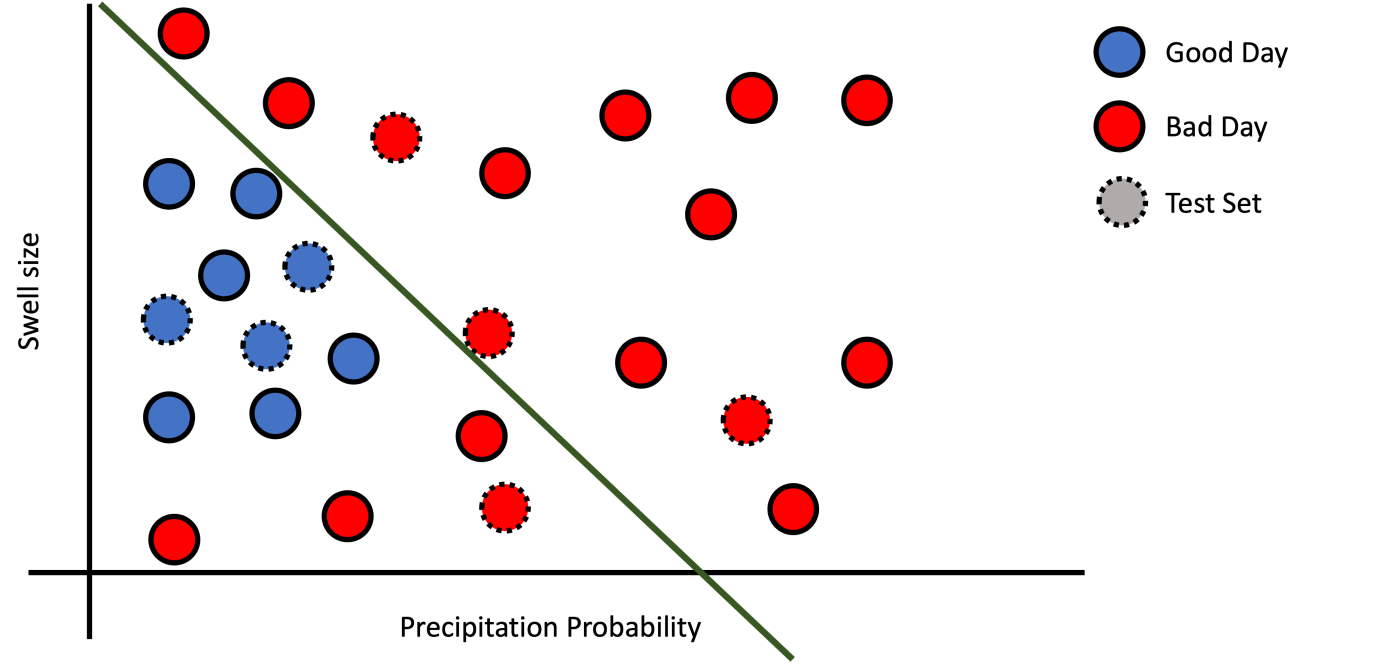
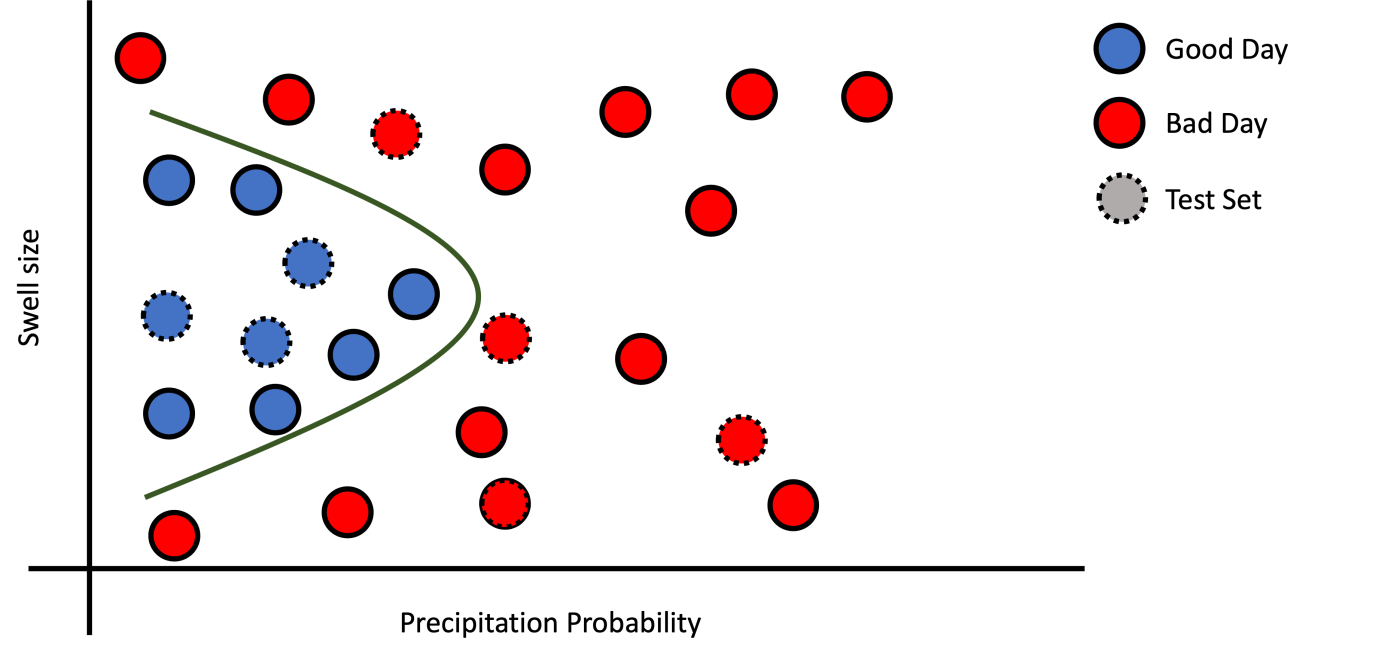
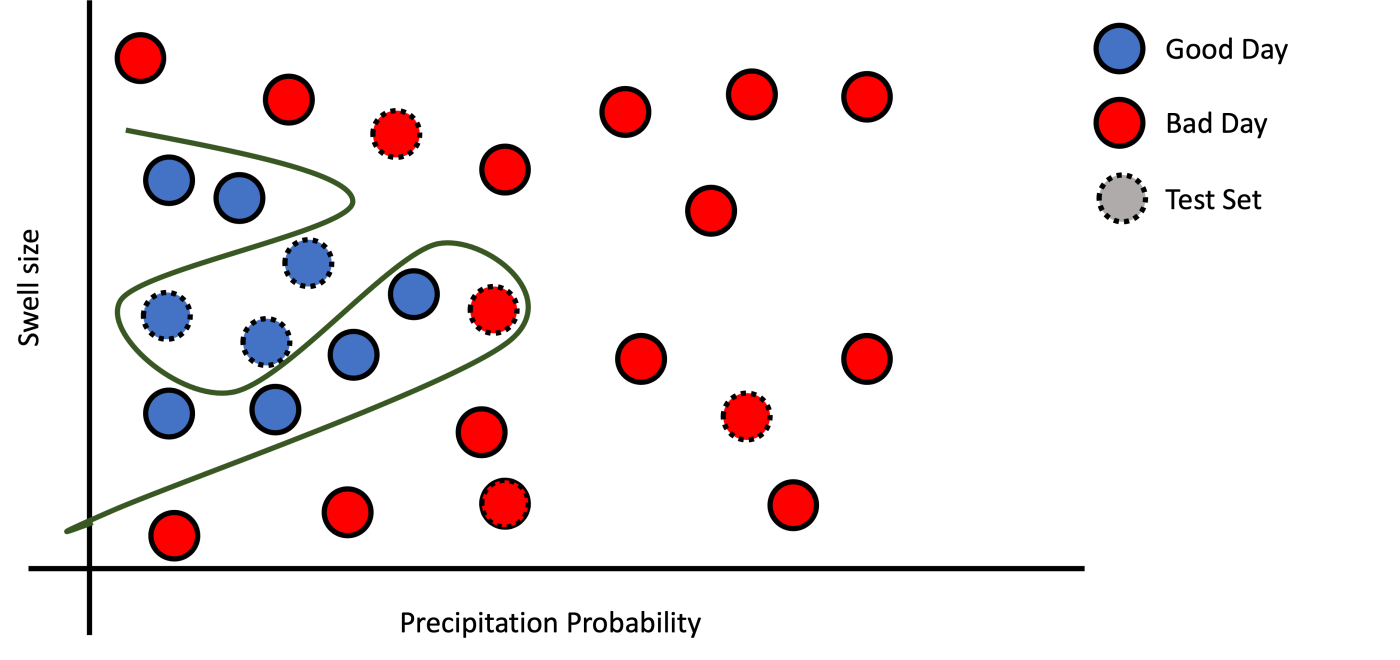
But how to formalize this pattern? First, we need to define what is a decision function. A decision function is a function that receives features or measurements as inputs and decides which class to assign based on the training data points. For a given training data could exist many decision functions. This depends on the complexity of the model and the data. Figure 2 shows three different decision functions that are valid for our example training dataset. Figure 2a shows a simple line (Logistic Regression) that divides good day examples from bad day examples.
Feature Representation
In machine learning, there are two things we can have control the model and the data. In this section, I will talk about the more important of both; the data. The data can have multiple representations and features, some relevant and others irrelevant to the target task. It is critical that the model receives enough information to make a good decision. You cannot expect a machine learning model to figure out the solution with irrelevant features or incomplete information.
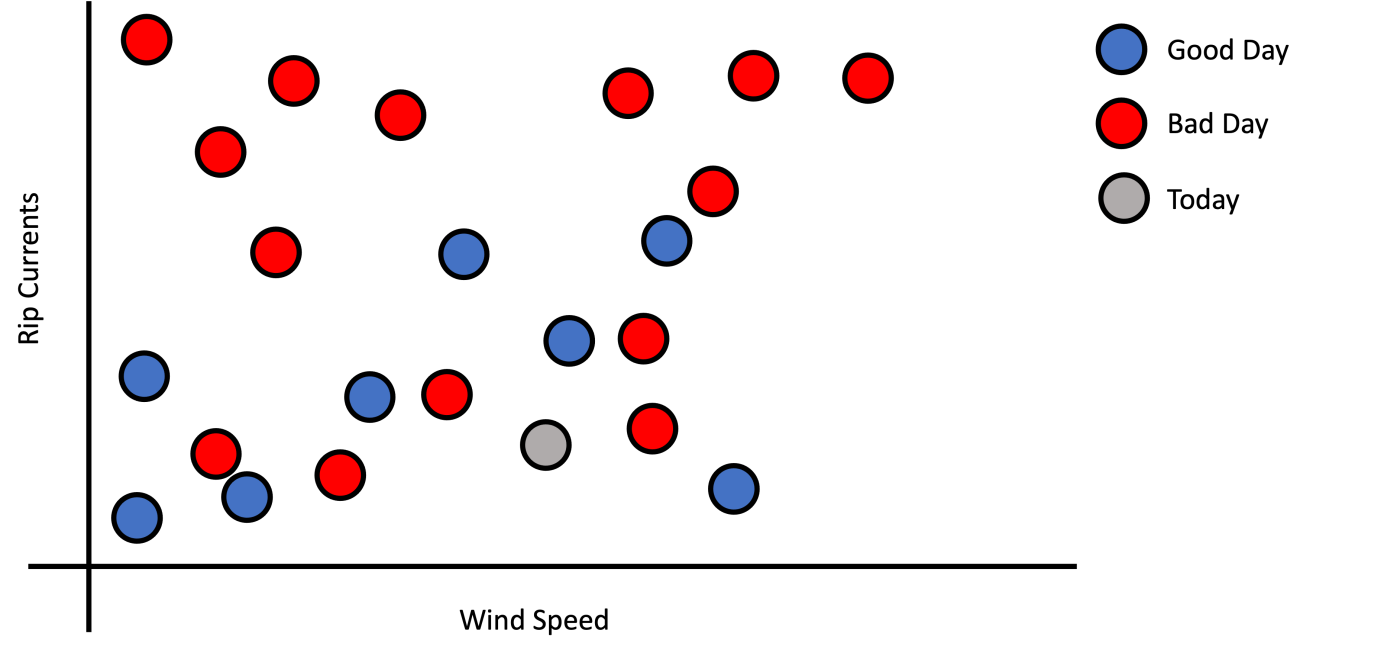
An example of irrelevant or incomplete information is Figure 3 that shows a graph where the y-axis was changed from precipitation probability to wind speed, which is irrelevant to solving this task. Notice that we introduce an irrelevant feature and remove part of the information relevant to solve this task. In the best case, the model ignores the wind speed features and relies on only rip currents. Depending on just precipitation probability, the model doesn’t have the complete information to make a good choice. The lesson here is that machine learning learns from reasonable patterns but does not make magic from data that does not make sense.
Generally, data scientists spend a considerable amount of time considering which features are relevant to solving the task. It is critical to remove irrelevant features because they can introduce noise to the model. Some features might are not good by themselves but combining them with others and transforming them into new combined features could result in relevant features. This process is called feature engineering, which consists of collecting and transforming certain features to simplify the feature representation of the problem.
Generalization
Now that we have a good representation and a good model that learn perfectly the training data. Are we ready to deploy our application to predict data from users? Well, not yet. First, we need to verify if our model can generalize to new data points never seen before. But how can we measure the generalization to all possible future data points? Should we collect the whole possible data points in our training set? The answer is no. Generally, we divide the dataset into two folds: the training set and the testing set. The idea is to evaluate the model on the testing set that contains novel examples that do not appear in the training set to approximate the generalization error.
Now that we have a way to approximate the generalization of a model, you can encounter the following scenarios:
- Poor training and testing performance (Underfitting)
- Good Training and poor testing performance (Overfitting)
- Good training and testing performance
Poor training performance indicates underfitting, meaning that your feature representation is not adequate or that the model is not complex enough for the training dataset. If various models do not provide good performance, maybe you should simplify the feature representation by doing feature engineering.
Assume that you have a model that learns how to perform some task, and when you tried to evaluate the model on the testing dataset, you found that it has a poor performance. This situation means that the model learned was capable of memorizing the training but did not generalize well; this is a sign of overfitting, which maybe be due to the high complexity of your model. You could try techniques to avoid overfitting. One of them is to reduce the complexity of your model.
If you encounter a good training and testing performance, you are good to go. Note that the testing performance most of the time is lower than the training performance. Maybe you should try to optimize some models parameter to improve your model performance.
Conclusion
In this introductory post about machine learning, we discussed how decision function uses training data to make decisions. We made an emphasis on how the input data representation could affect your model performance. Also, we introduce the testing set as a way to approximate the generalization error. I hope that after this post, you now have good intuition and understand how machine learning works.