plotbee
Plotbee is a library to process, manage and visualize pose-based detections of bees.
The Data Structure
Plotbee has a simple data structure based on videos, frames and bodies (skeleton detections). Where a video is a list of frames and a frame contains a list of bodies.
from plotbee.video import Video
video = Video.load("plotbee_video_data.json")

for frame in video:
    for body in frame:
        pass
A body is consists as set of keypoints and connections. Plotbee functionalities are centered on video and body operations such as tracking (video operation) or pollen detection (body operation). Most of the visualization are at frame and body level.
Vizualization
The current plotbee format just store data related to keypoint detection, tracking information, pollen detection and tag detection. But do not store the image of the video. Therefore, for visualization the video file is need it.
import videoplotter as vplt

video.load_video("plotbee_video.mp4")

frame = video[0]
body = frame[0]

vplt.imshow(frame)
vplt.imshow(body)

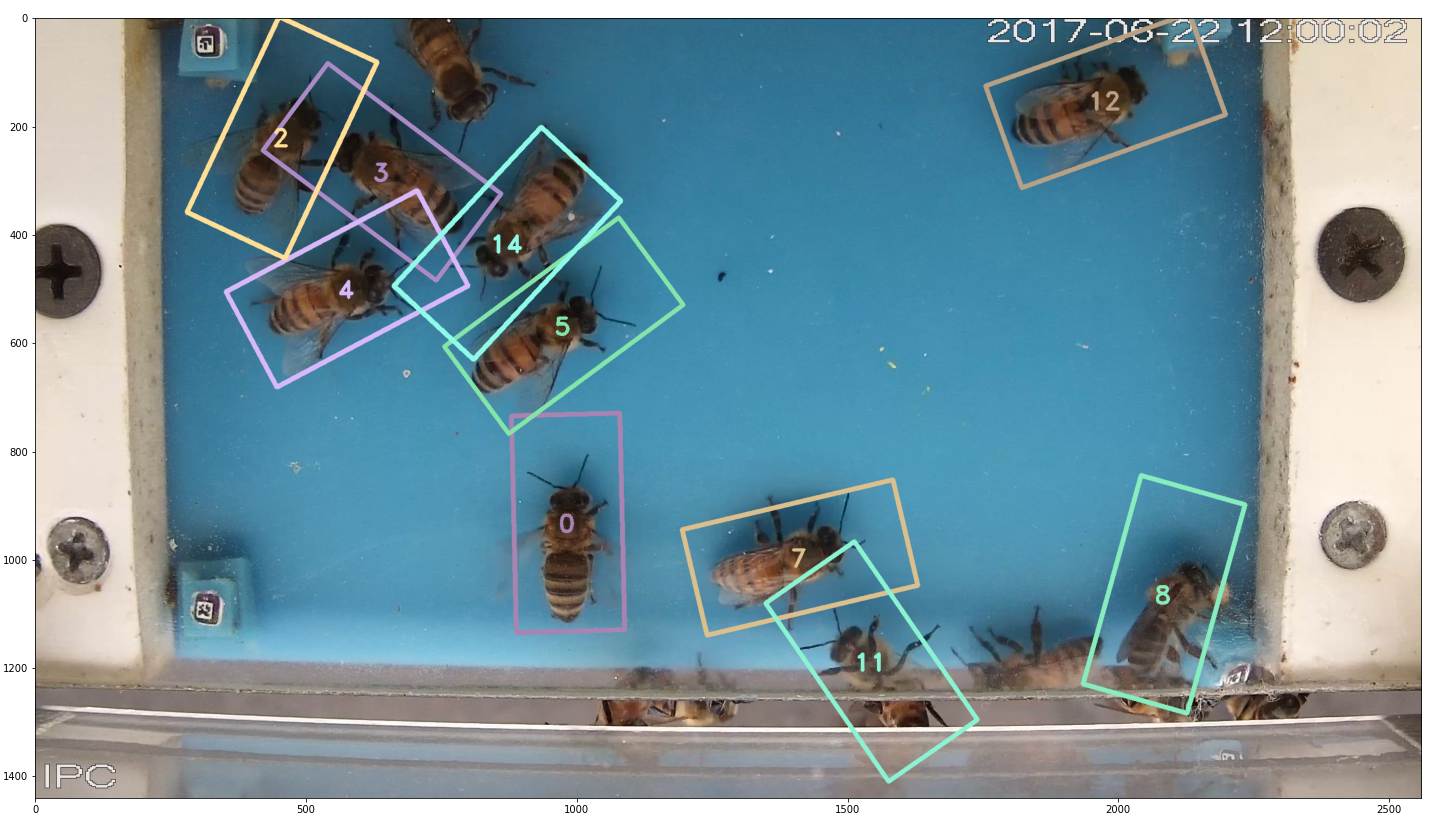
vplt.imshow has options to show skeletons, bounding boxes, tracking and id text.
vplt.imshow(frame, skeleton=False, bbox=True, tracks=False, idtext=True)
Other Processes
Tracking
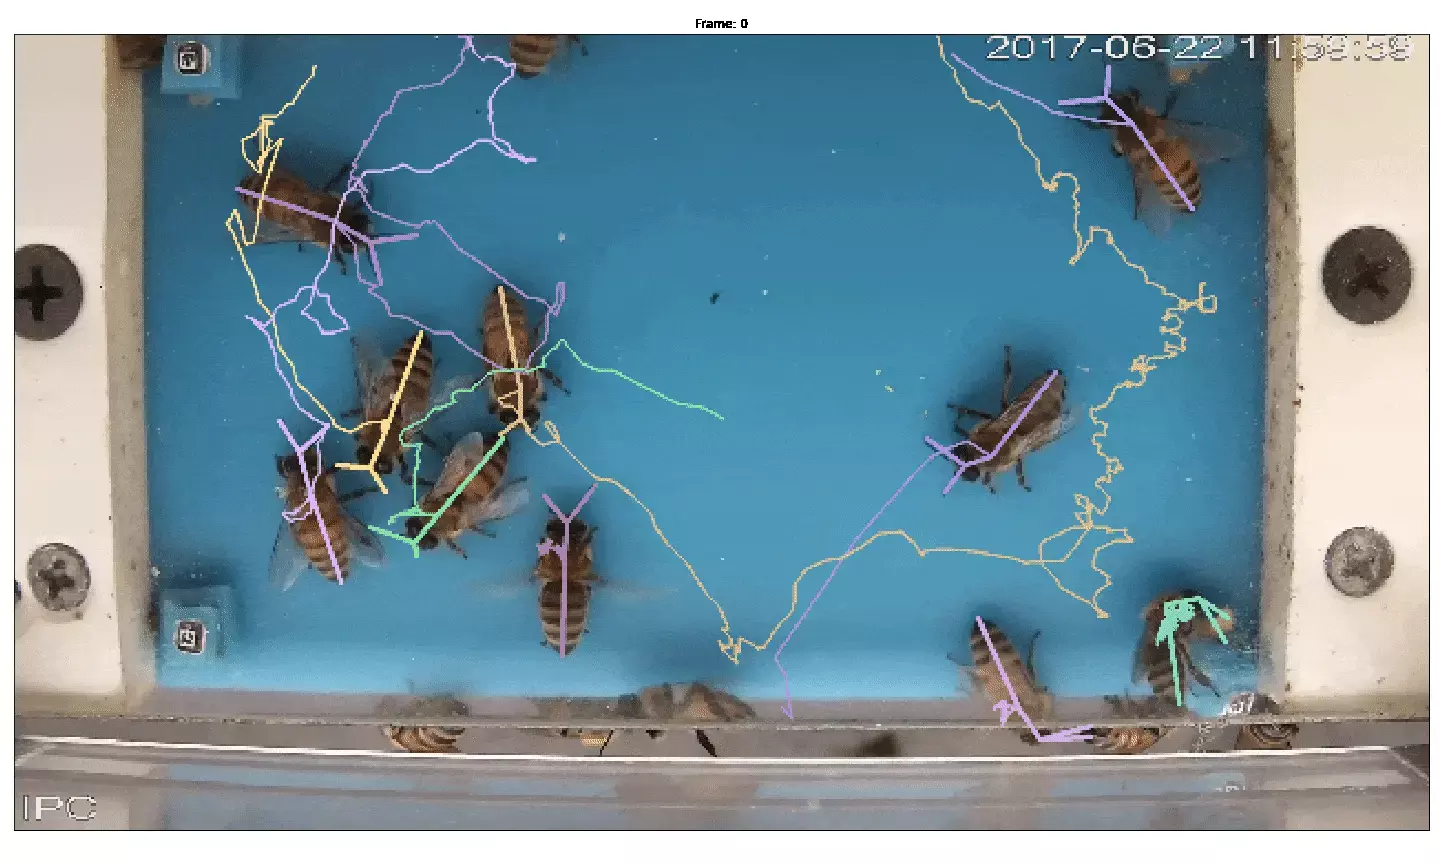
One of the important task to collect information about bees is tracking. The plotbee tracking is a greedy assigments of the detectecions based on distances.
video.hungarian_tracking()
Pollen Detection
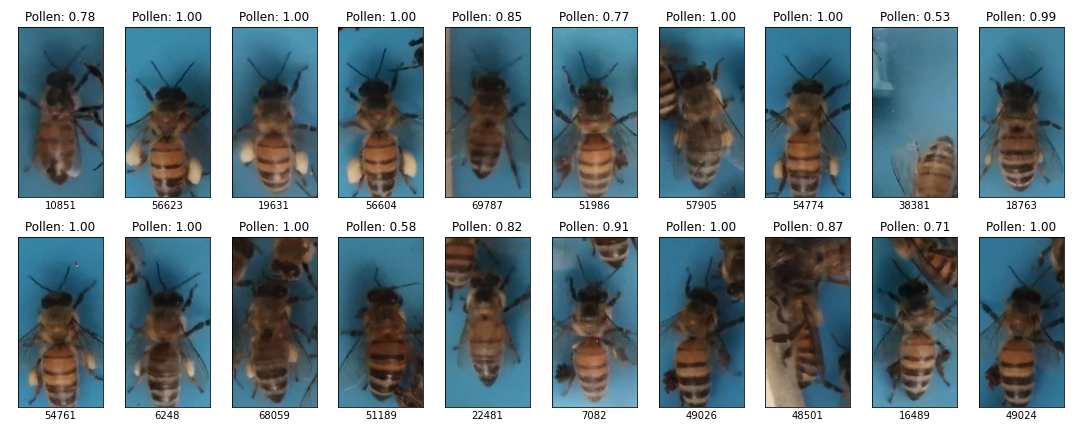
Pollen detection is based on a convolutional neural network to classify if a body contains pollen. If a body contains pollen then body.pollen == True.
# Pollen Detection
video.process_pollen(model_path, weights=weights, workers=workers)

# Visualization
pollen_bees = list()

for frame in video:
    for body in frame:
        if body.pollen:
            pollen_bees.append(body)

shuffle(pollen_bees)
vplt.contact_sheet(pollen_bees[:20])

Tag Detection
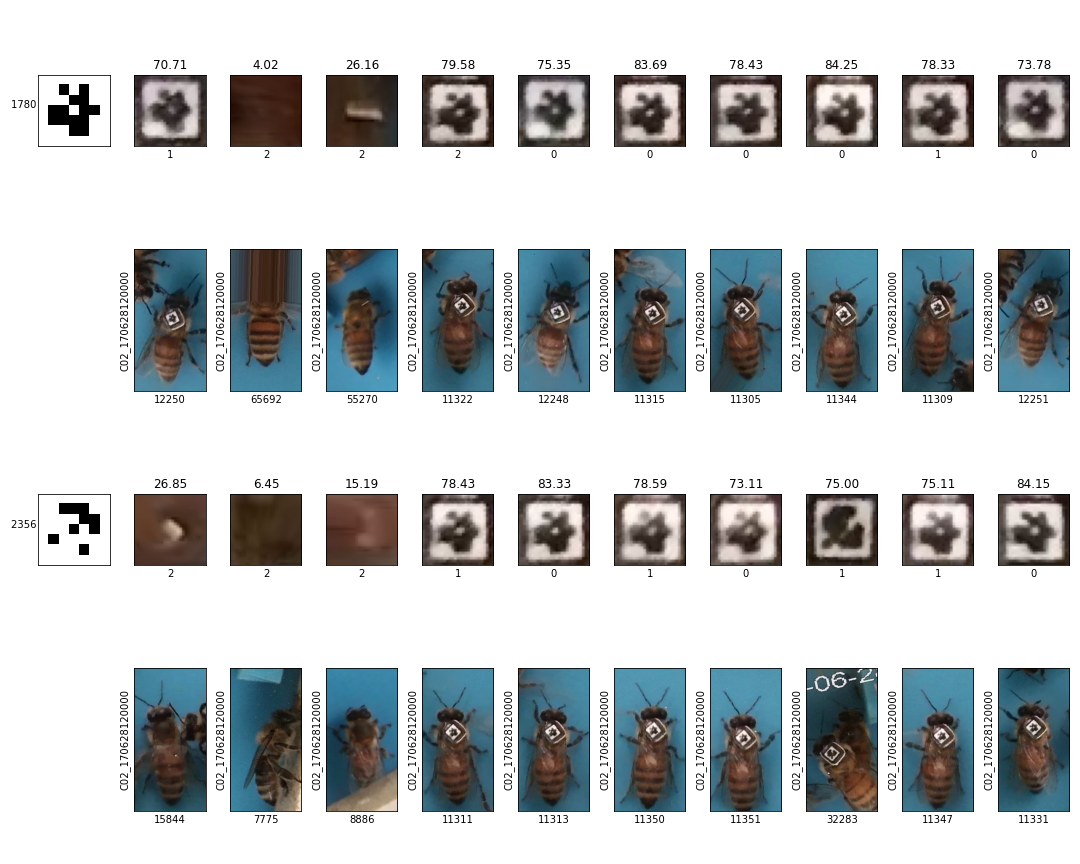
In our setup, some individuals carries a marker to be recognize in long-term monitoring. More information about this tag setup in the paper. Plotbee includes detection of tags using an implemetation of Apriltags.
# Tag Detection
video.tag_detection()

# Visualization
tagged_bees = video.tagged()

shuffle(tagged_bees)

vplt.tagged_contact_sheet(tagged_bees[:20])

Conclusion
This is just an overview of the plotbee library to show the power of this library, but there some features that are not explained here.
